Don’t know how to use Google Forms for data analysis? We have got you covered.
Google Forms is one of the most widely used tools for creating surveys, quizzes, and data collection forms. Whether you’re gathering customer feedback, conducting research, or tracking responses for an event, Google Forms makes the process seamless. But what happens after you collect that data?
In this blog, we will take you through a detailed blog on how you can use Google Forms for data analysis.
Table of Contents
Understanding Google Forms for Data Analysis
When it comes to data collection, Google Forms offers a user-friendly way to gather a variety of responses. But the real magic happens when you begin to analyze the data you’ve collected. Fortunately, Google Forms simplifies this process, allowing you to gain valuable insights without needing to be a data expert.
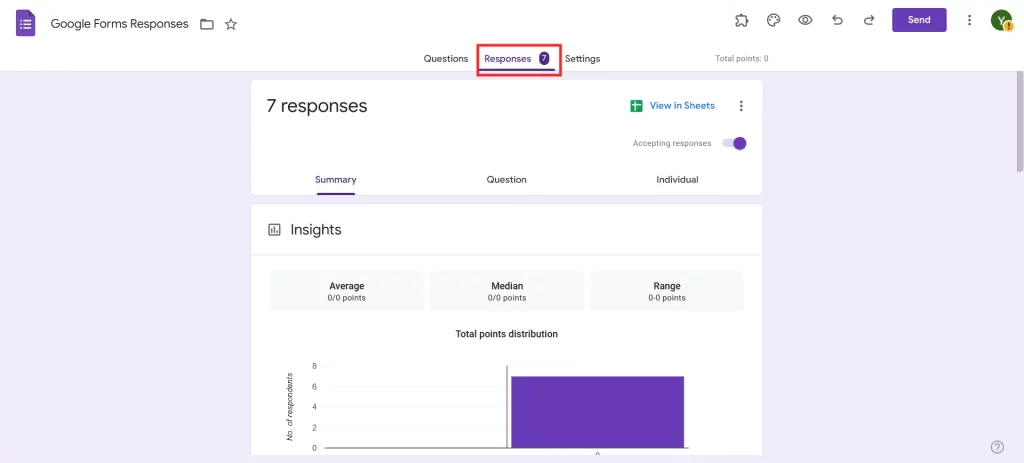
Once your form is live and responses are rolling in, you’ll notice that Google Forms automatically stores this data in a spreadsheet within Google Sheets. This makes it easy to manipulate, analyze, and visualize your results with minimal effort.
Looking for extensive customization of the timer in Google Forms? Read, ExtendedForms Unveils: Customized Timer Themes.
Key Features for Effective Data Collection
Before jumping into analysis, it’s important to focus on the key features of Google Forms that ensure effective data collection:
- Customizable Question Types: In Google Forms, there are multiple options that we can use to create questions: multiple-choice, dropdown, text, and checkboxes. It was better to select the best question type in order to get the structured data that would be easier to analyze.
- Response Validation: To provide for validation of the responses, Google Forms allows the use of response validation that can be set up. This feature assists you in excluding such responses that are incomplete or invalid to your surveys before they get to your spreadsheet.
- Real-Time Data Collection: The moment they start providing their response to the questions set forth in Google Forms, the program collects and saves their responses. It also means that you can begin capturing data almost as soon as you publish your form and do not need to wait for a certain period.
- Response Notifications: Google Forms has the option of informing the manager each time a form has been completed. This may prove especially helpful in case you are monitoring a live event or require instant analysis.
Google Forms Insights: Tracking Response Trends
One of the most useful aspects of Google Forms for data analysis is its ability to identify trends across responses. For instance, if you’re gathering feedback on a product, you might start seeing patterns in answers that can help guide your next steps.
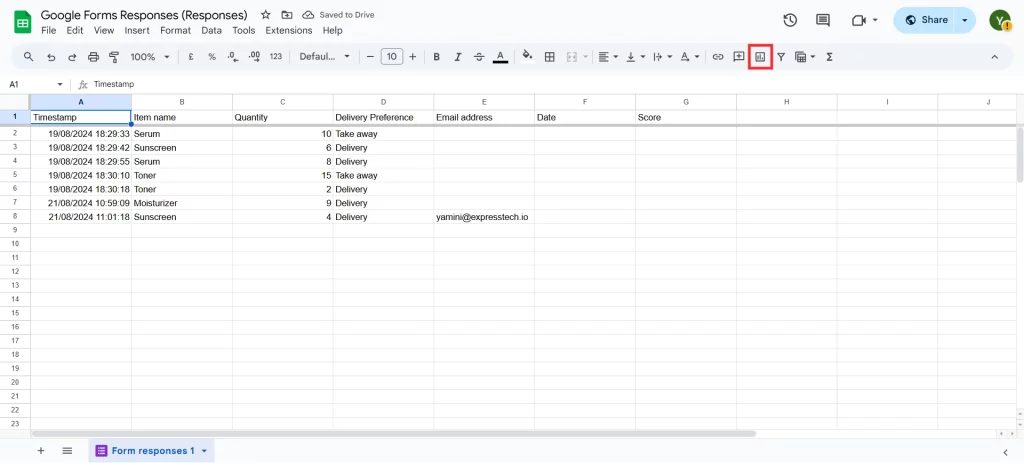
- Response Summary: In analysis, Google Forms gives users an option of a summary which gives the number of people who responded to a particular question. This could shortly bring out any similarities in the responses that are given by different respondents.
- Automatic Grouping of Similar Responses: When completing multiple choice or check box questions, Google Forms does this for you by grouping responses. It enables you to know which choices are your favorite and even gives you a live picture of the information.
- Filtering and Sorting Responses: If you need more detailed insights, you can use Google Sheets’ built-in tools to filter or sort your data. For instance, you could filter out responses from certain demographics or sort answers based on specific preferences.
Are you a business owner who wants to create a form? Read, How to Make a Customized Business Form With Google Forms? (4 Easy Steps).
Visualizing Your Data for Better Google Forms Insights
Understanding your data becomes much easier when you can visualize it. Google Forms for data analysis makes it simple to generate charts and graphs, so you can turn raw numbers into easily digestible insights.
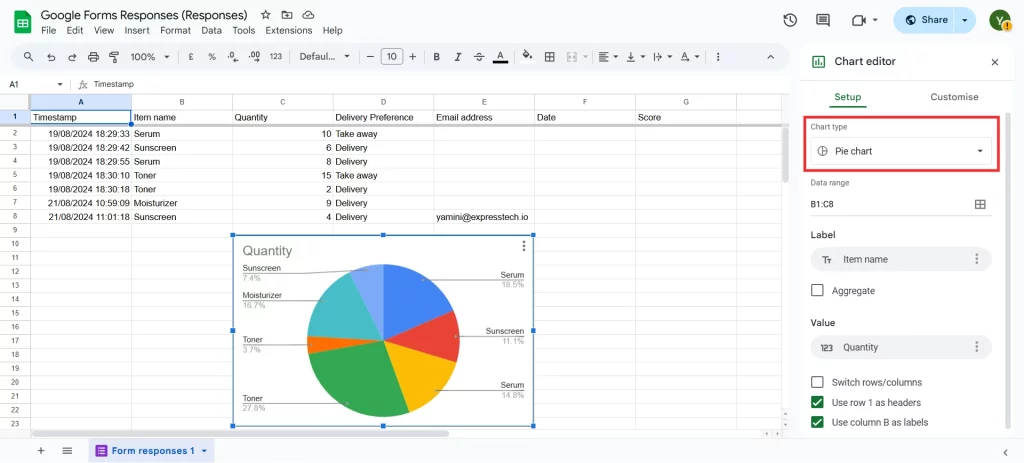
- Using Built-In Graphs and Charts: Once you’ve linked your form to Google Sheets, you can automatically generate graphs and charts based on your data. Google Sheets offers a variety of chart types—bar charts, pie charts, and line graphs—all of which can help illustrate response trends.
- Customizing Graphs for Clarity: Google Sheets allows you to customize these charts to highlight what’s most important. You can change colors, adjust labels, and even add trend lines. Customizing your graphs ensures that you present your data in the most effective way possible.
- Data Exploration with Pivot Tables: If you’re looking for deeper analysis, Google Sheets’ pivot table function is a powerful tool. Pivot tables allow you to organize and summarize data, making it easier to compare multiple variables, like how age demographics affect responses.
Utilizing Built-in Graphs and Charts
Now that you’ve gathered data, you’ll want to make sense of it. Google Forms automatically generates graphs and charts for you, which can be found in the “Responses” tab. These charts display the data in a simple and visual way, helping you identify trends and patterns instantly.
- Bar Graphs: These are great for comparing different options, such as how many respondents chose each answer in a multiple-choice question.
- Pie Charts: For questions with fixed responses, pie charts give a quick visual of how each answer is proportioned.
- Line Charts: If you’re tracking progress over time, a line chart can show you how responses are changing.
These built-in graphs provide an excellent starting point for understanding your data. However, there are more advanced ways to make the most of Google Forms for data analysis.
Third-Party Data Visualization Tools
While Google Forms and Google Sheets offer powerful built-in features, you can enhance your data analysis by integrating third-party tools. These tools offer more advanced visualizations and can help you create interactive reports, and dashboards, and even automate your data analysis
In Conclusion
Google Forms is a fantastic tool for data collection, but it shines even brighter when you harness its data analysis capabilities. From the moment your responses come in, you can track trends, visualize your findings, and dig deeper into the data to uncover insights. Whether you’re using built-in charts in Google Sheets or integrating with third-party tools, Google Forms gives you the flexibility to analyze your data in meaningful ways.
So, the next time you’re gathering data via Google Forms, don’t just collect it- analyze it!
If you like reading this blog on how to use Google Forms for data analysis, also read our detailed guide on How to Add a Hyperlink to Google Forms. (7 Simple Steps).
