
If you have created a Google Form, for any reason, the core idea would be gathering information and then analyzing it for further use. Analytics in Google Forms helps you analyze the responses that your users have submitted via Google Forms.
Google Forms is a powerful tool that helps you with extensive customization of your forms and surveys. It also has prebuilt templates that can help you with the ideation of your forms.
Here, in this blog, we will take you through a detailed guide on how you can view analytics in Google Forms.
Table of Contents
Why View Analytics in Google Forms?
Interpreting the result of Google Forms is essential if one has to comprehend the response, and make improvements or decisions for future forms. You don’t have to worry about spending a lot of time analyzing the data collected, as there is built-in analytics in Google Forms that will help you to see responses that you have been receiving from the people you surveyed.
- Insight into Responses: Such insights make it easier to install into programs normalities in the responses, or general viewpoints in one direction or another. This knowledge is, therefore, helpful when analyzing the results to get a distilled perspective of the respondents’ sentiments.
- Data-Driven Decisions: This means that you will make choices based on the answers received through a data analysis of the results. It also assures that every action entails data-based results and this will enhance the achievement of targeted goals.
- Identifying Trends: Metrics help to identify patterns or mission-critical issues that may be mentioned repeatedly when answering a survey question. This can be especially helpful for identifying changes in attitudes, tastes, or patterns − for example, from year to year.
- Improving Future Forms: Identifying and analyzing the responses can be useful in revealing areas of the form that need enhancement. For example, you may come across questions that the participants sought to complete or have shown signs of confusion; this makes you revise and improve the subsequent forms, so they are easy to solve.
- Visual Representation: To view the result, Google Forms comes gifted with formats like Bar graphs, Pie charts, lists, etc. The following are some of the benefits of using graphs: These representations make use of graphics that help in making concepts clearer and enable one to pass on the findings to others.
- Immediate Feedback: To understand how the form works and how it performs, you can view the analytics of the form. This is because you can be able to evaluate within a short duration whether the form is capturing the right information and possibly altering it to achieve the intended goal.
Hence, if you can frequently check out the analytics in Google Forms that you are using for your data collection, then you can be assured that not only are your methods on target but they are also progressive.
How to View Analytics in Google Forms
Step 1: Open Your Form
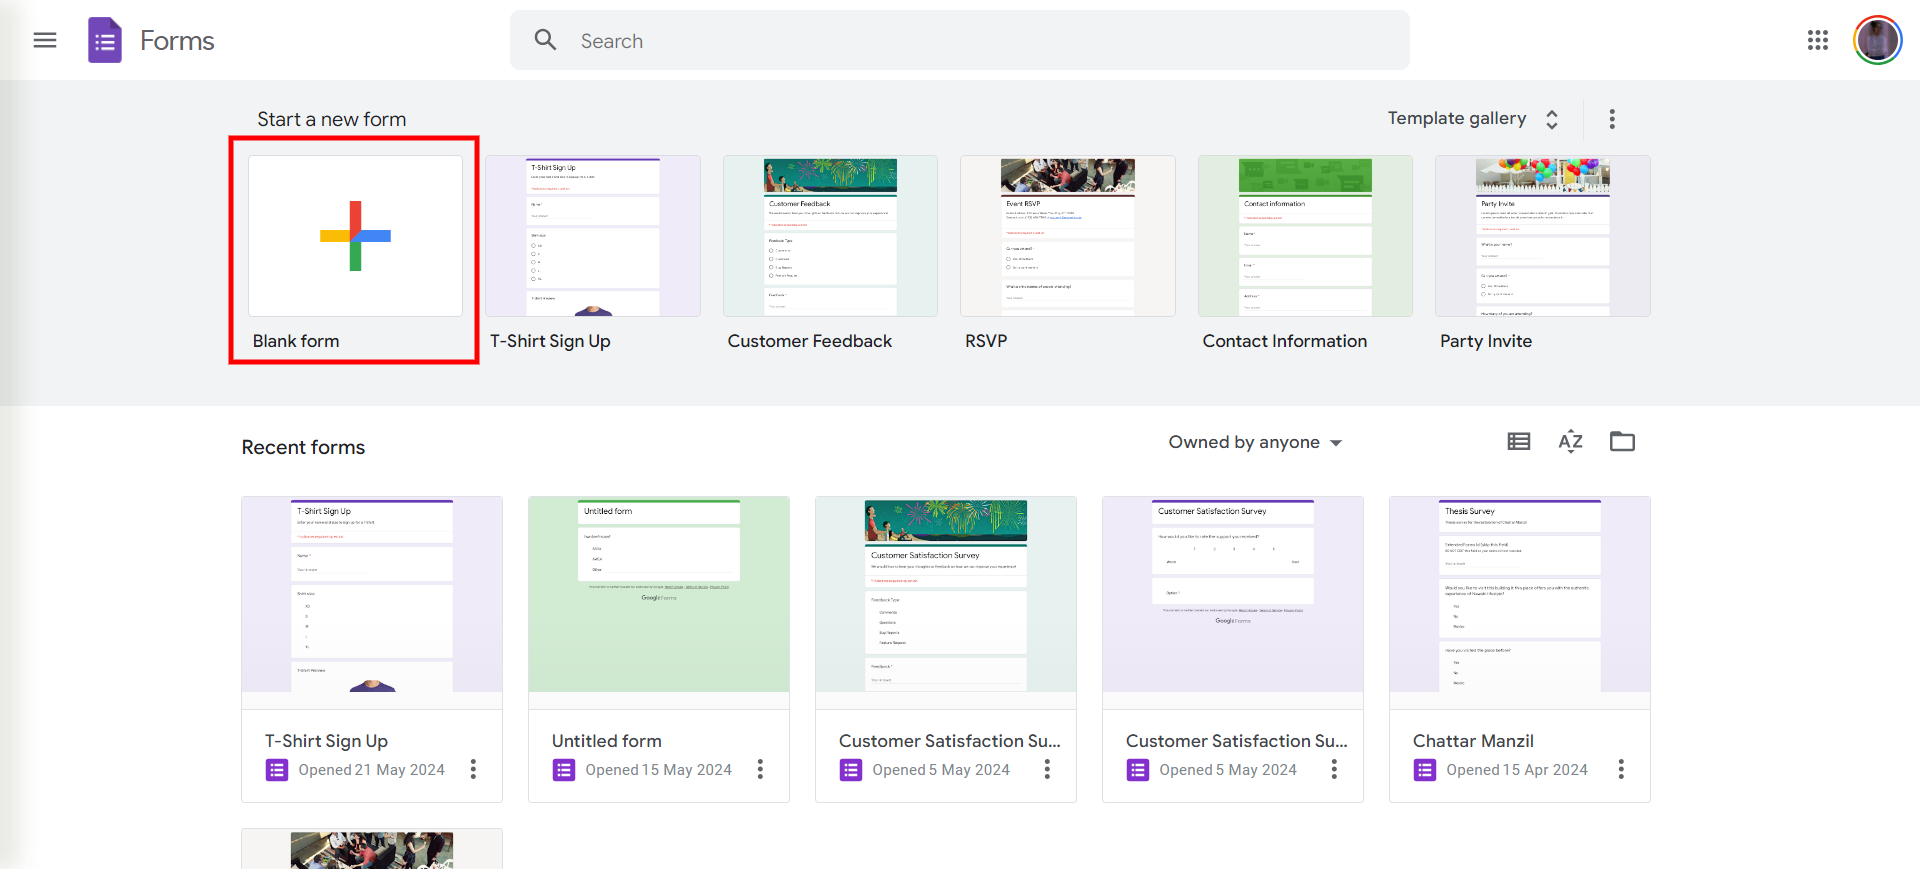
Open your Google Forms. After you have opened the home page of the site chosen, go to the recent forms section and choose the form you’d like to evaluate. If you cannot locate your form in the above list, type directly in the search box, the name of the form that you are looking for and hit enter.
Step 2: Go to the Responses Tab
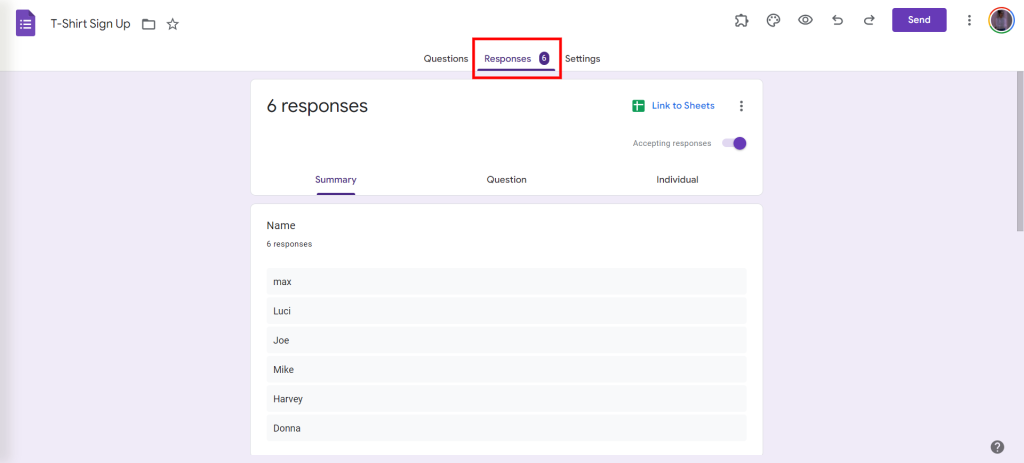
On the Google Form you created, below the “Responses,” you will find the actual number of responses that your form gathered. Click on the tab on the top labeled “Responses” from the “Questions” tab.
Step 3: Choose to View Your Summary
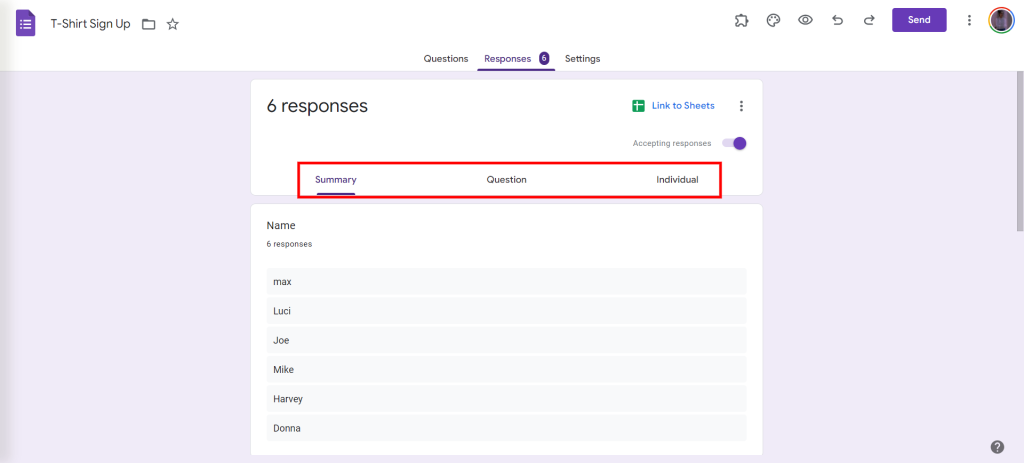
Under the Responses tab, you’ll see three sections: Summary, Question, & Person.
- Summary: Gathers all the answers that users submitted in your form.
- Question: The outcomes of the survey are presented by questions.
- Individual: This document provides an analysis of all the answers that were submitted by all the respondents in the completed form.
When it comes to considering the overall metrics of your Google Forms, consider the Summary tab.
Looking for an easy way to collect data in Google Forms? Read, How to Collect Data with Google Forms? [2 Best Ways]
Step 4: Analyze Your Results
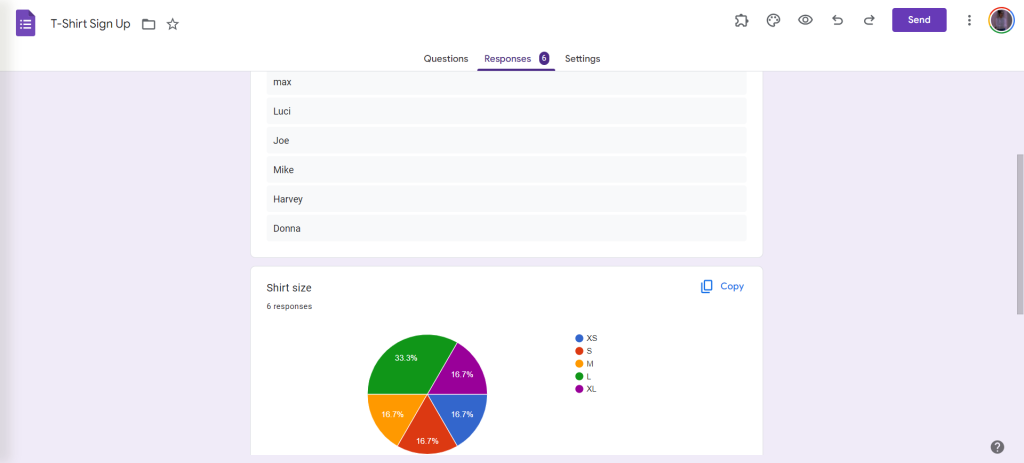
Evaluating the results that Google Forms offers is quite easy because Google Forms automatically chooses the best format in which the results should be displayed. Let’s break down the Summary for this form.
- Linear Scale Question: The results are depicted on a bar graph on the Summary page. The horizontal axis indicates the point on the linear scale while the vertical axis gives the response regarding the total numbers. At the top of each point on the linear scale, the number of responses and the proportion of total responses are indicated.
- Multiple-Choice Question: Google Forms sums it up and presents the responses in a pie chart. On the left are the total number of years people would volunteer again, and on the right, are the different answers people chose. As seen from the pie chart below, the research has also indicated the percentage of respondents that have the particular answer.
For example, out of 10 responses, respondents chose between the first three answer options, with no one selecting the last choice, “Adding sections.”
- Descriptive Question: Google Forms keeps all the answers in a list format to preserve the individuality of subjective answers.
This is how you can do data analysis with the Google Forms response summary page. It is very simple and graphical, as Google Forms can guess the most suitable type of response to present it in the most comprehensible way.
Want to connect your forms with Google Sheets? Read, How to Connect Google Forms to Google Sheets? (Explained in 2 ways).
Create Timer Based Forms With Extended Forms
ExtendedForms addon in Google Forms helps you add a powerful timer in Google Forms that enhances the assessment process, prevents cases of cheating, and enhances effectiveness in data collection. It is a feature-rich plugin that offers you customized timer themes. This way the duration of responses can be regulated and thus the overall completion of forms becomes more systematic and less procrastinated.
Adding timer-based forms with ExtendedForms helps you:
- Enhance Assessment Accuracy: Timer-based forms guarantee that the respondent completes the form in a certain period which is very important for timed forms such as quizzes as well as tests. This maintains fairness and makes it easier to ensure all the participants complete the form under the right conditions thus improving the reliability of the assessment.
- Maintain Academic Integrity: It can be seen that timed forms can minimize cases of cheating in learning institutions. This eliminates the chances of respondents consulting other people or using search engines to find answers, thus making the responses more genuine.
- Improve Time Management Skills: Timer-based forms can potentially enhance students’ time management skills. In essence, timed assessments enable students to understand time management and how to complete tasks within a specified period.
- Ensure Prompt Responses: For example, while conducting surveys or feedback forms, having a certain time limit can guarantee that the opinions are spontaneous. This is particularly useful whenever you want a fast response.
- Streamline Workflow: The timer-based forms may prove useful in more structured organizational assessments such as employee evaluation or training effectiveness. Completing forms within a given time will help in managing and processing responses efficiently.
- Bring a Sense of Urgency: A timer can force individuals to be attentive and avoid delaying the completion of the form as seen below. This can result in increased response rates and shorter time required to complete the surveys or evaluations, especially if they are time-sensitive.
- Limit Overthinking: However, there might be situations where limiting the time, in which the respondents will be able to complete the form, can result in more natural and spontaneous answers. This can be especially helpful when you aim to get the respondents’ first impression or intuition.
Thus, using timers in Google Forms can improve the quality of the data collected as well as the fairness and efficiency in various processes and settings.
In a Nutshell
We hope this blog has helped you understand how to view analytics in Google Forms. Analytics in Google Forms provides a better and more tangible understanding of your forms’ responses. With these detailed insights, you can craft your future business strategies, such as new marketing campaigns and product launches, with greater precision. L
Leveraging this data, you can identify trends, measure engagement, and make informed decisions to drive your business forward. By continually analyzing your responses, you’ll be equipped to refine your approach, ensuring that your efforts align with your audience’s needs and preferences.
If you like reading this blog about analytics in Google Forms, also read our details guide on How to Allow Multiple Domains for Form Sharing With an Organization and How to Add Tables in Google Forms. [2 Ways].